

Now a days in era of 3G / 4G & upcoming 5G , everyone is feeling well connected via internet. It seem like we can do anything with the mobile in our hand. Just losing connectivity for some minutes also , we feel helpless. It really becoming one of the basic needs after Roti, Kapada & Makan. This connectivity issues which we face time to time though our mobile network service provider can affect our productivity. Losing our precious time on solving the connectivity issue or running behind the mobile range may seems normal but indirectly we are stopping our own growth. Many mobile service provider still not able to deliver expected standards in their services may be due to poor infrastructure, not maintaining redundancies etc. but after crossing our frustration threshold we always think about changing the provider. It is really necessary to get good continues service for our own growth & India’s growth too.
According to economic times “Now that India is emerging as one of the fastest digitalise in countries and the digital economy is projected to touch $1 trillion, we estimate that it is already around $350 to $370 billion so the fundamental platform on which digital India will grow is telecom. So, telecom is going to be one of the major trust sectors, going forward.
We had a recent ICRIER study, which said that while generally a 10 per cent increase in Internet penetration leads to 1.3 per cent incremental increase in GDP. For India this study was particularly noteworthy because it said that increase of mobile usage by 10 per cent actually lead to a 3.3 per cent increase in GDP. Since this is almost three times the global average, it shows that mobile is emerging as a major economic engine.”
Now think about , this major economic engine suffering the problems such as low quality of service , backed by poor infrastructure etc. To overcome this TRAI (Telecom Regulatory Authority of India) has provided a great analytical tool for Exploring the Mobile Data experience of consumers across India & enabling them to choose the best service provider in your area. This provides interactive map based analytical data of all mobile data service provider in india.
http://www.analytics.trai.gov.in/
TRAI Analytics Portal has 3 sections focusing on different aspects as follows :
- My Speed Portal : Focusing on Speed of 3G, 4G data service providers in your area.
- QoS Analytics Portal : focusing on Quality of service of mobile operators in area of interest , user can check operator wiser / service provider tower wise call droping rates etc.
- Drive Test Portal : As most of the user face call drop / call block problems while driving inter or intra city this portal focusing on network range issue detected for all service provider in different city roads / highways.

Consumer can check 3G/4G data service experience from all the service provider across india , it will give the best speedy mobile internet provider in your area

User can choose the Operator , 3G / 4G & enter location on map to check the best choices & performance for selected operator
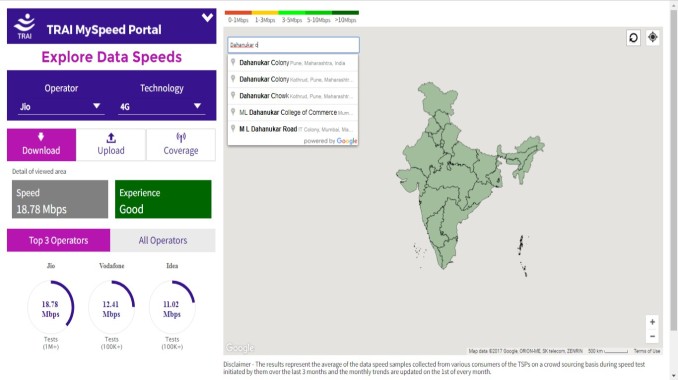
Enter the location for which you want to check the data speed

eg. Dahanukar Colony , Pune. It will show top 3 operator & coverage of your selected operator in that area with speed range in Mbps
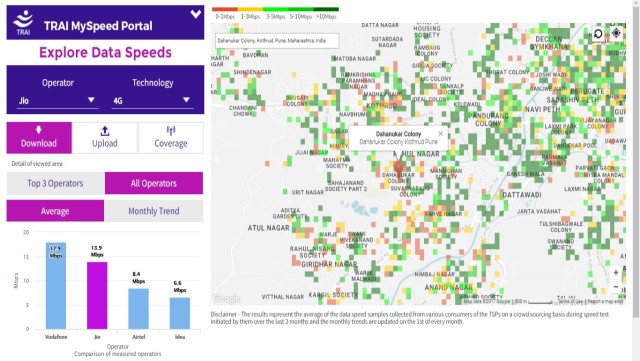
Select All operator option for comparison data upload, download speed & coverage in area of interest
- QoS Analytics Portal : focusing on Quality of service of mobile operators in area of interest , user can check operator wiser / service provider tower wise call droping rates etc.

It focuses on quality of service provided by different service provider in your area of interest.

Enter the location of interest

Select the Operator : it will provide the details of tower near to you for selected operator & call drop rates on it. (in %)

Also it will give you details of call drop rates across all service providers in your area for last 2 months
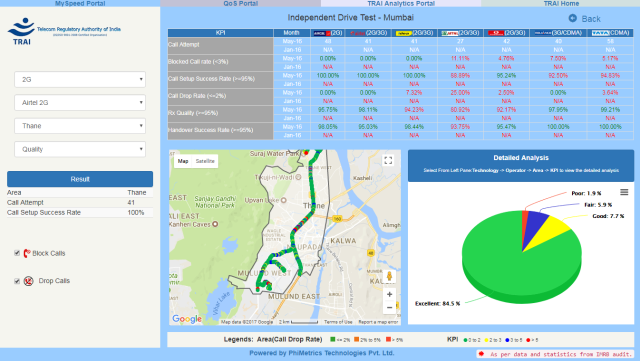
- Drive Test Portal : As most of the user face call drop / call block problems while driving inter or intra city this portal focusing on network range issue detected for all service provider in different city roads / highways.

Network coverage on selected highways & city roads

Selected Mumbai city for example.

It will provide details of all the roads & operator wise call drop incident details.
User can set the criteria & select the data for any specific area for detailed analysis.
I hope it will be really helpful while deciding on best suitable mobile service provider for you, thank to TRAI.
courtesy: http://trai.gov.in/


